UNDERSTANDING BUSINESS METRICS CAPTURED ON INCOME STATEMENTS
Income Statements capture numerous business metrics which can be used by shareholders’ and other stakeholders to determine the financial health of an organization. A few of these critical metrics are discussed below –
GROSS MARGIN
Gross margin (or Gross profit) is the profit made by an organization after deducting costs associated with making & selling its products (or costs associated with providing services) from sales revenue. These costs are normally termed as Cost of goods sold (COGS).
For most of the organizations, it would be calculated as –
GROSS MARGIN = SALES REVENUE - COST OF GOODS SOLD (COGS)
GROSS MARGIN % = (SALES REVENUE - COST OF GOODS SOLD) / SALES REVENUE
Cost of goods sold (COGS), can also be understood as the variable costs that goes into manufacturing & selling of products or providing services for an organization.
For any organization, Cost of goods sold (COGS) is likely to include sub-heads like –
- Raw material costs
- Commissions for sales staff
- Shipping charges borne by the company
- Credit card fees on customer purchases
- Contractual labor costs (labors which work on daily wages)
The list provided above is not exhaustive and is likely to vary depending on the industry. As a thumb rule, COGS should include all the variable costs that goes into creating & delivering the product or service.
Example. A corporation reported a sale of $500,000 in an accounting period with “cost of goods sold” as $200,000. Gross margin in this case can be calculated as –
Gross Margin = Sales Revenue – COGS = $500,000 – $200,000 = $300,000
Gross Margin % = (Sales Revenue – COGS) / Sales Revenue = $300,000/$500,000 = 60%
EBITDA (EARNINGS BEFORE INTEREST, TAXES, DEPRECIATION & AMORTIZATION)
Some investors & shareholders’ prefer this metric over Net Income as a better indicator to determine the financial health of an organization. An EBITDA calculation strips off cost of capital investments (depreciation) and expenses related to debt & taxes and thus is more preferred choice by investors for evaluating companies in asset heavy (or capital intensive) industries like Oil & gas, Mining, Manufacturing, Telecommunication etc.
Net Income for asset heavy industries is expected to be low because of heavy capital expenditures (heavy capital expenditures lead to high depreciation expenses thus low Net Income). In such cases, investors & shareholders’ prefer EBITDA values as a better measure of company’s operational performance & profitability.
EBITDA can be calculated from an Income statement using the below formula –
EBITDA = NET INCOME + INTEREST + TAXES + DEPRECIATION & AMORTIZATION
OPERATING INCOME
Operating income is the profit realized by the organization from its primary business activities. It is calculated by deducting operating expenses from sales revenue.
OPERATING INCOME = SALES REVENUE - OPERATING EXPENSES
Operating expenses represent the expenses incurred by the organization in facilitating its primary business activities. It is often abbreviated as OPEX.
Expense heads like cost of goods sold, sales commission, “Selling, general & administrative expense (SGA)”, rent, insurance, marketing & advertising expense, depreciation expense, utilities expense, wages expense, research & development expense etc fall under the purview of operating expense.
EBIT (EARNINGS BEFORE INTEREST & TAXES)
Investors prefer this metric when comparing organizations within asset light industries. Examples of such industries could be Service industries, Technology, Consulting etc.
EBIT can be calculated on Income statement using the below formula –
EBIT = NET INCOME + INTEREST EXPENSE + TAX EXPENSE
DIFFERENCE BETWEEN OPERATING INCOME & EBIT
Some financial texts often confuse EBIT with operating income. One must take caution in using these terms interchangeably as theoretically they are different and often do not conclude to same values.
Operating income is calculated by considering only the operating revenue & expenses whereas EBIT (Earnings before interest & taxes) considers revenues & expenses from both operating & non-operating activities of the business.
EBIT can calculated from income statement using following formula –
EBIT = OPERATING INCOME + (NON-OPERATING REVENUES - NON-OPERATING EXPENSES)
EBT (EARNINGS BEFORE TAX)
EBT reflects how much profit an organization has realized before accounting taxes. Investors use EBT to evaluate organization’s operating performance by eliminating tax factor which is outside of their control. It becomes critical metric to look upon when comparing companies affected by different federal & state taxes.
On an income statement, EBT can be calculated by using the following formula –
EBT = NET INCOME + TAX EXPENSE
NET INCOME
Net Income is the amount remaining after adjusting sales revenue with all kinds of expenses, gains and losses for the organization. It is also referred to as “bottom line” of the income statement. If positive, it must be labeled as Net Income or Net earnings; if negative, it is labeled as Net Loss.
Net Income as percentage of sales is often considered an important metric when comparing two separate entities.
EARNINGS PER SHARE (EPS)
It is mandatory for a corporation (publicly traded entity) to publish Earnings per share (EPS) on its income statement. It is calculated by “dividing net income applicable to common stock by the number of shares of common stock outstanding. (Treasury stock are not be considered as common stock for this calculation)
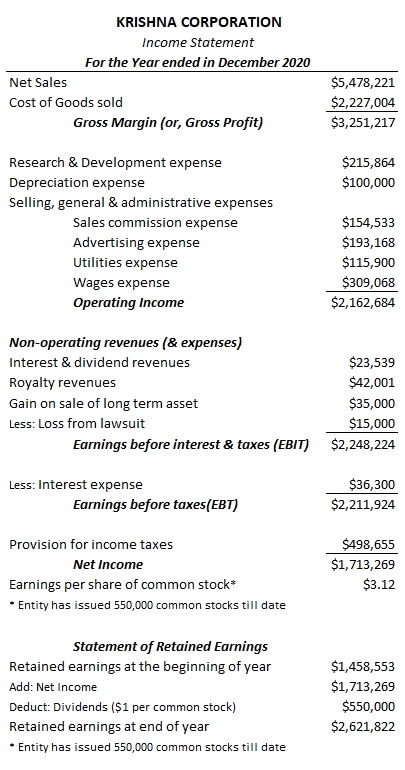
Example. In the year 2020 Krishna corporation reported net income of $1,713,269. The corporation had 550,000 shares of common stock outstanding during period 2020. Therefore, Earnings per share for Krishna Corporation would be $1,713,269/550,000 =$ 3.12per share
Example. ABC Corporation in 2020 reported a net income of $10 million. It had outstanding 2 million shares of common stock and 100,000 shares of preferred stock (with annual dividend of $10 per share) convertible into 200,000 shares of common stock.
For calculating EPS in this case, preferred stock dividend of $1,000,000 (10*100,000) must be subtracted from net income to arrive at net income applicable to common stock. Therefore, EPS = (10-1)/2 = $4.5 per share
Example. XYZ Corporation in 2020 reported an annual income of $10 million. On January 1, they had outstanding 1 million shares of common stock. On July 1, the company issued additional 2 million shares of common stock. The stocks issued later would therefore remain outstanding for the half of the year. In this case, the weighted average number of common stock outstanding throughout the year would be 1+0.5*2 =2 million shares.
Thus EPS would be calculated as 10/2 = $5 per share