OTHER METHODS OF ANALYSIS
So far, we discussed Net Present Value (NPV) concept for evaluating capital investment projects. There are two alternative concepts as well which analysts often use to analyze capital investment projects. They are –
- Internal rate of return (IRR) method
- Payback method
INTERNAL RATE OF RETURN (IRR) METHOD
Selection of an appropriate required rate of return or discount rate is often quite challenging while using NPV method for evaluation. To avoid it, internal rate of return (IRR) method was introduced for evaluating capital investments. In IRR method, that rate of return is calculated at which the present value of cash inflows becomes equal to present value of investment i.e. the rate at which the NPV becomes zero. This rate is called as the discounted cash flow (DCF) rate of return or simply the internal rate of return. IRR method at times is also referred to as the DCF method.
Example. Calculate the internal rate of return (IRR) for an investment of $5,000 which is expected to yield following cash inflows –
$2000 in the year 1 and $4000 in the year 2 (Assume useful life of the project to be 2 years only)
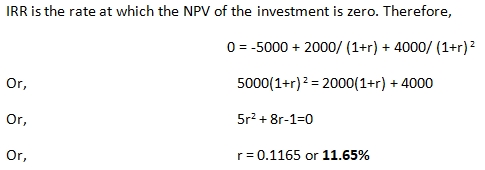
Therefore for this project, the management can expect approximately 12% rate of return on its investment. If they are aligned with these rate of return; they can proceed with the project execution; else they can drop it.
The process of determining IRR manually for complex business scenarios can be quite tedious; in practice, computer programs like excel or financial calculators are used to perform these calculations quickly.
PAYBACK METHOD
Payback period for an investment is the time period in years in which the original investment amount can be retrieved back as cash inflows generated from the investment.
Example. If an organization invests $1,500 in a machinery which generates $500 cash inflow every year, it is said to have a payback period of 3 years.
If the useful life of the project or investment is greater than its payback period; project can be accepted. Ideally, the lesser is the payback period than its useful life; the better it is for the company.
PAYBACK PERIOD CALCULATION IN CASE OF UN-EVEN CASHFLOW
Example. Calculate the payback period for an investment of $20,000 that yields cash inflows as follows – $4000 in the year 1, $2000 in the year 2, $6000 in year 3, $7000 in year 4 and $8000 in year 5
Payback amount required = $20,000 (Initial Investment)
Cash inflows till year end 4 = $4000 + $2000 + $6000 + $7000 = $19,000
Cash inflows till year end 5 = $27,000 ($19,000 + $8,000)
Thus, payback period for this investment is expected to be in between 4th-5th year.
$19,000 has been recovered till the end of Year 4. Pending investment to complete the payback amount is $1000 ($20,000 – $19,000)
Total cash inflows in Year 5 = $8,000 (to be gained within 12 months of Year 5)
Assuming uniform cash inflows throughout the year,
$1,000 can be gained in (12/8000)*1000 months = 1.5 months
Thus, payback period for this investment is 4 years 1 month 15 days
DISCOUNTED PAYBACK METHOD
In principle, discounted payback analysis works exactly same as normal payback analysis. The only difference here is that instead of adding future cash inflows directly (or as it is); their present value is considered for comparing with the original investment and determining payback period. The payback period calculated based on present value of future cash inflows is termed as discounted payback period.
Thus in this case, a discounted payback period of 5 years would mean that the total cash inflows generated over this duration when discounted at the required rate of return will recover the original investment amount. Needless to say if the useful life of an investment is shorter than the discounted payment period (calculated at required rate of return); the project would be dropped.
NPV V/S IRR
Organizations often face two classes of problems while dealing with capital investment decision making. The first class of problem is related to screening multiple proposals where the fundamental question is, if or not to accept a proposal basis their return. For tackling such proposals either NPV or IRR analysis can be used.
Other class of investment problem is often considered difficult and is related to ranking the proposals in the order of their necessity & returns that they are likely to generate. These rankings are necessary for the organization when evaluating several worth-while proposals. While considering these kinds of proposals, organizations often employ both NPV & IRR analysis for their evaluation.
Let’s have a look at the below examples to better understand the possible business scenarios.
Example. Consider an organization is evaluating two different projects Alpha & Beta, having 1 year of economic life and cash inflows of $150,000 and $420,000 respectively. The investments required for projects Alpha & Beta are $100,000 and $300,000 respectively. You are required to help the organization in deciding which of the two projects should be given a priority? (Assume cost of capital to be 7%)
Note. While comparing NPV & IRR; it is advisable that cost of capital used in the NPV method should be cost of risk free capital (and not the company’s expected rate of return).
Risk free capital is the return that you can earn on your investment without taking any risk, say by investing your capital in government bonds or in saving accounts of your bank where a guaranteed return is promised.
IRR and NPV can be calculated for Project A & B using the techniques discussed earlier and data for the two projects can be summarized as below –
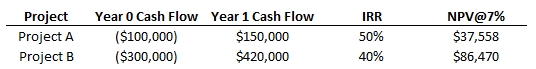
Things to consider in the above table –
- Economic life of the both the projects are same
- 3 times initial investment is required to start project B as compared to project A
- IRR is higher for Project A ;NPV valuation of Project B is higher
Therefore, if we benchmark projects using IRR metric, Project A looks attractive while considering NPV metric, Project B looks better. So, which one to choose?
There could be multiple lines of thought while evaluating a preferred project out of these two.
- NPV is an indicator of net wealth that any investment is going to add to your bank accounts. So clearly, Project B is the preferred project here as by the end of year 1; it is expected to return approximately $50k more as compared to Project A
- Another school of thought could be, that Project A requires 1/3rd of the initial investment as compared to Project B. Considering the remaining 2/3rd investment can be made into some other project such that the cumulative return on this total investment surpasses the returns gained from Project B alone. In that case Project A would be the preferred project for the organization
- Another use case could be that company currently do not have the required funds to execute Project B. In such a case as well, Project A will be a preferred project for the organization
Example. Consider an organization is evaluating two different projects A & B. Project A has an economic life of 1 year and Project B has an economic life of 3 years. Numbers for these projects can be summarized as below. Which of the two Projects should be preferred?
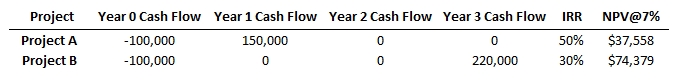
Observe the following from the table –
- Initial investment is same for both of these projects
- Economic life of the project A is 1 year; and that of Project B is 3 years
- IRR is better for Project A; NPV is better for Project B
The situation in this example can be analyzed on the similar lines as we discussed in the earlier example.
Considering Net addition of wealth alone in three years time horizon (NPV metric); Project B should be the preferred option for the organization as it adds approximately $35k more as compared to Project A in the same duration.
However, if the organization believes that after year1, they can invest the gains from Project A somewhere else such that by the end of 3 years the cumulative gains are higher than that of Project B alone, in such a case Project A looks more attractive and must be a preferred choice for the company.
Important thing to note here is that we have just considered the quantitative aspect of projects while evaluating them for the organization. In practical, qualitative aspects of projects might overshadow the quantitative analysis. Therefore both aspects are equally important and must be considered in evaluating the preferred project for the organization.